

Acerca de este curso
Compártelo


- Project Overview
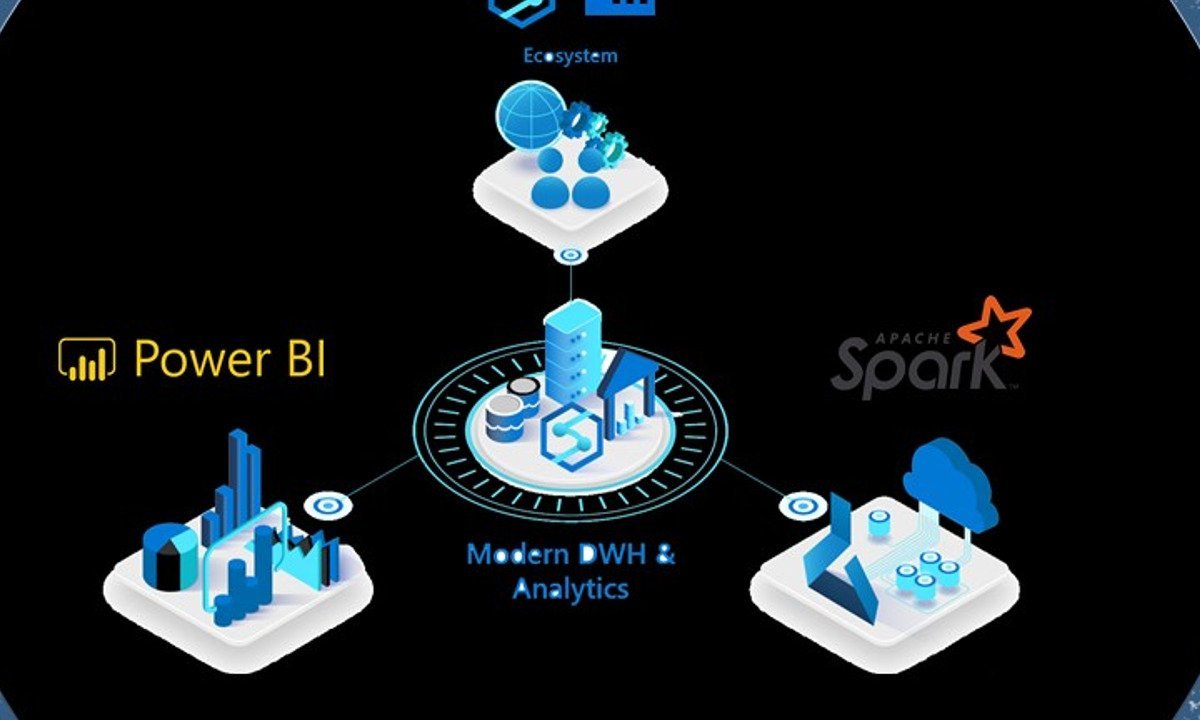
- In this 1.5 hour long project, we will be creating an income statement dashboard filled with relevant charts and data. We will begin by importing the data into Power BI. We will then transform the data in the power query editor to make it usable. We will then create different kinds of visualizations like tables, cards and charts. By the end of this course, you will be confident in creating financial statement dashboards with many different kinds of visualizations.
Cursos relacionados


GRATIS Aprendiendo a aprender: Poderosas herramientas mentales…

Deep teaching solutions

Español

GRATIS Programación para todos (Introducción a Python)
University of Michigan
Inglés

GRATIS The Science of Well-Being
Yale
Inglés

GRATIS Negociación exitosa: Estrategias y habilidades esenciales
University of Michigan
Inglés

GRATIS Primeros Auxilios Psicológicos (PAP)
Universitat Autónoma de Barcelona
Español

GRATIS Chino para principiantes
Peking University
Inglés
¿Te apetece valorar
nuestra web?
4.3 / 5 ( 3432 votos )
¿Preparado para tu próximo proyecto laboral?
Copyright © 2022 Mooc. Todos los derechos reservados